
Beau Legeer is director of the Imagery and Remote Sensing GBD team at Esri. His team works closely with partners and customers on their imagery data and analytics needs. He has over 25 years of experience working with commercial and government customers to solve problems using remotely sensed data and analytics. He specializes in solutions that enrich GIS using imagery and remote sensing data sources.

Lori Scott is chief information officer and vice president for technology and partnerships at NatureServe, which, for nearly 50 years, has been the authoritative source for biodiversity data throughout North America. Scott oversees NatureServe’s technology team, with a portfolio that includes software product development, user support, and IT infrastructure for mission-critical enterprise information management and delivery systems.
Some of the largest technology companies in the world have compiled petabytes of data, filtered through artificial intelligence and machine learning, to help political leaders, businesses, researchers and others understand the Earth’s climate and how it is changing.
Microsoft launched AI for Earth in 2017, intended to put cloud-based, AI-filtered data into the hands of researchers. That evolved into the Planetary Computer, also aimed at putting actionable data into the hands of those who need it.
In 2019, geographic information services giant Esri devoted its annual user conference to discussing the concept of an intelligent “geospatial nervous system,” an interconnected GIS network that reveals patterns and visualizes trends, allowing for well-informed environmental decisions.
“Sustainability really requires that we see the world as one system,” Esri founder and CEO Jack Dangermond said in a late 2021 Ted Talk. “Today, in my field, the geospatial field, we are seeing technologies emerge that are becoming interconnected. They’re allowing us to measure, analyze and understand what’s happening on our globe.”
IBM launched its Environmental Intelligence Suite in late 2021, a suite of environmental intelligence software that uses AI to help organizations prepare for and respond to weather or climate issues that could disrupt business, and also to help them understand their own impact on the planet.
All have something in common: taking data and measurements derived from various sources, such as satellites, unmanned systems and researchers on the ground, and filtering it through artificial intelligence to help local environmental stakeholders understand their surroundings, mitigate the effects of climate change, monitor endangered species and habitats and more.
IBM’s Environmental Suite is business focused, as it could be used “to help retailers prepare for severe weather-related shipping and inventory disruptions, or factor environmental risks into future warehouse locations; energy and utility companies to determine where to trim vegetation around power lines or which of their critical assets may soon be at greater risk from wildfires due to climate change. Or the suite could be used to help supermarkets get a clearer picture of how refrigeration systems are contributing to their overall greenhouse gas emissions and prioritize locations for improvement,” IBM said in announcing the suite.
The suite “takes advantage of AI-driven innovations from IBM Research that make it easier for climate and data scientists to analyze massive environmental datasets, and a new climate risk modeling framework used to generate data on future wildfire and flooding risks. Additionally, the suite will leverage unique technologies from IBM Research which apply natural language processing and automation designed to help companies estimate carbon emissions and identify opportunities to reduce them across their operations or with suppliers.”
Microsoft’s Planetary Computer is more aimed at conservation programs, as the company says key applications include global land use and cover applications and mapping; deforestation risk analysis; ecosystem monitoring; conservation planning and forest carbon risk assessment.
The data comes from a variety of sources. For example, the Planetary Computer draws multispectral imagery from satellite measurements, including the Landsat program; air quality measurements from Project Eclipse in Chicago; data on endangered species from NatureServe’s Map of Biodiversity Importance; forest inventories and analysis from the U.S. Forest Service; climate data from the National Oceanic and Atmospheric Administration; demographic data from the U.S. Census Bureau; infrastructure overviews from Bing Maps; and dozens of others.
Beau Legeer, Esri’s director of imagery and remote sensing, said the geospatial nervous system concept came out of Dangermond’s “trying to wrap his head around the importance of GIS geographic information systems in monitoring and responding and mapping and providing awareness of the global system that we live in. What it boils down to is that the globe, the Earth, is kind of like a nervous system. There’s some type of stimulus and then a response.
“The way we think about it is, the Earth is just a set of locations,” Legeer said, whether that be a natural disaster or just human activity. …Those can all be mapped by bringing together multiple pieces of information.” That information could include street maps, imagery, data from environmental sensors, news feed, social media feeds, tweets, photographs and more.
“The GIS can bring that all together and add a location,” Legeer said. “So, you have all this information. A response could be just building awareness of it and presenting that information in a form that is publicly consumable.” That could be a natural disaster along the lines of Hurricane Ian. “So, let’s first build awareness of the situation. Let’s bring in the road network. Let’s bring in spatial analytics, which talk about which roads are blocked, which houses are destroyed, and then present that in a dashboard that says, ‘OK, I’m in this area. I have these roads blocked.’ The number of houses damaged and the response can be an insurance company going in to that dashboard and sending in claims adjusters, but it could be informed by that map or that information product.”
Having information can be helpful even before an event happens, Legeer said.
“Let’s talk about the Amazon deforestation. It’s really easy to look at a satellite image and see that OK, a year ago there was this much forest and now it’s this much forest. But when you bring multiple layers of information together, there’s more to it. The first indicators of deforestation are new roads. So, when you see new roads come in, whether they come in from overhead pictures on the ground information, you know that’s an indicator that it’s happening before the cut. When you’re looking at satellite imagery, it’s already done, and all you’re doing at that point is you’re just making people aware that it’s already been done, but that geospatial nervous system would say, you know what, there are indicators there that a cut is about to happen. There are new roads being put in. There are smaller clearing areas where vehicles are being staged.
“You know, up until I worked on that, it was like everything was forensic in nature. It’s, let’s see what happened. This is more like, let’s see what’s going to happen and potentially maybe there’s an opportunity to make people aware of it before.”
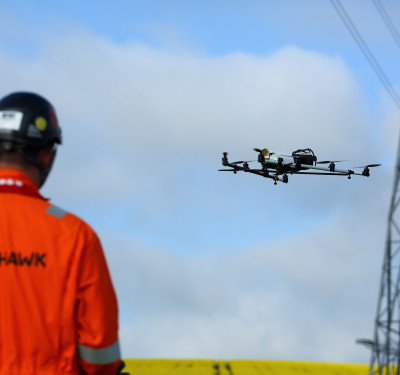
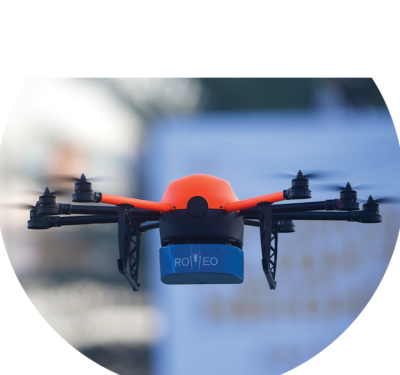
Esri customers are doing this on a much more local level as well by flying drones using Esri software to keep track of changes over time. Leeger said the company is seeing the largest growth in this with architectural and engineering and construction users.
They can fly drones over their sites once a week, he said. “They could never do that before and what they’re doing is, they’re looking at safety hazards. They’re combining drones with some type of machine learning identification to look for things that shouldn’t be on the site…it’s exciting to see people transforming their businesses using these unmanned systems.”

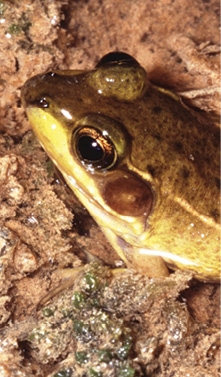
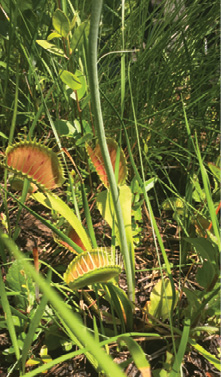
(LEFT) A Hops Azur butterfly. (MIDDLE) A Florida bog frog (Lithobates okaloosae), listed as imperiled by NatureServe. (RIGHT) A Venus Flytrap (Dionaea muscipula), listed as imperiled by NatureServe. Photos courtesy of Michael Meneffee/Colorado Natural Heritage Program, Kevin Enge/Florida Fish and Wildlife Conservation Commission Fish and Wildlife Research Institute and Misty Buchanan/North Carolina Natural Heritage Program.
COMPLEMENTARY
Legeer said the IBM, Microsoft and Esri platforms are complementary, basically big data in search of users.
In particular, with the Planetary Computer, “they harvest government provided data sources, whether they’re imagery or vectors or other pieces of information that the taxpayers pay for, they make it available, but they make it available in their cloud, which allows for users to process that data using computational resources that were not possible before on your local desktop, so it’s complementary to us because our software just runs on those cloud resources.
“And it appears like we’re sitting next to petabytes of data. Just enormous amounts of data,” Legeer said. “And so, it’s a wonderful marriage between Microsoft and IBM because you’re able to process that data. They’re building a lot of AI and ML [machine learning] models on that data, which we can use with our software.”
For example, Esri works with a partner that is running models to generate land use classification.
“Those maps used to be very expensive to make and very time consuming, so you get a picture of the Earth’s land use maybe once a year, once every other year. But because of what Microsoft’s doing with their AI and their cloud data, those can be run almost monthly now. You get these monthly maps, which you can put into a GIS system, and look at what we call the thematic change and the thematic change that says hey, for this spot it used to be deciduous grasses, but now it’s concrete.”
USE CASES
IBM said components of the Environmental Suite were in use even before the new package was created. BP Bunge Bioenergia in Brazil, an ethanol, bioelectricity and sugar company, used environmental data and geospatial analytics to help it better understand its sugarcane production and market intelligence. Agribusiness company Cajamar in Spain used IBM’s Plataforma Tierra tool to help Spanish farmers improve yields and reduce environmental impact.
The Planetary Computer has been used by the Pacific Community, the principal scientific and technical organization for 27 countries and territories in the region, to begin work on Digital Earth Pacific, a database allowing the region to tackle challenges such as climate change, food security and disasters.
The program is just getting underway, but by 2027 to 2029, the plan is to have users not only using data from Digital Earth Pacific but creating their own products and services powered by the system’s data.
“Digital Earth Pacific will become an operational public good that will regularly generate products whenever a satellite flies over, which will make it reliable and robust. Countries will be able to access the information the same way people access weather reports on their phones, any day of the week,” Pacific Community Director-General Stuart Minchin said in a Microsoft web feature.
One organization that has worked with both Esri and Microsoft is NatureServe, which spun out from the Nature Conservancy and has used data and technology to monitor endangered habitats, plants and animals for nearly five decades.
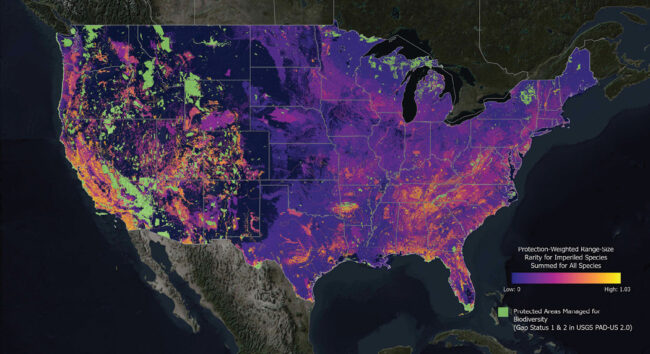
In the winter of 2020, at an Esri conference, the group announced the Map of Biodiversity Importance, or MOBI, a catalogue of 2,200 species at risk of extinction in the lower 48 states of the U.S., including, for the first time, a set of plants, freshwater animals such as crayfish as well as more well-studied groups such as birds, amphibians and mammals.
The data is a subset of the group’s largest database, NatureServe Explorer, Lori Scott, NatureServe’s chief information officer and vice president for technology and partnerships, told Inside Unmanned Systems. Both Esri and Microsoft helped support its creation; it’s built on Esri software, a longtime NatureServe partner, and was supported by a grant from the AI for Earth program.
NatureServe uses a five-point vulnerability scale for species, with G1 being globally critically imperiled, the most at risk of extinction. G2 is imperiled, G3 is vulnerable. “We tend to focus on the most imperiled, G1 and G2, sometimes G3 end of the scale,” Scott said.
MOBI focuses on G1 and G2. It includes field data collected by the NatureServe Network’s army of botanists and zoologists, overlaid with numerous other information layers from some of the same sources that inform the Planetary Computer. Together, the maps and layers can help pinpoint the locations of endangered species, allowing governments and other organizations to make informed decisions about protecting them.
“We’d like to do more, we would like to get down to all the G3 species, probably a couple thousand more,” Scott said. “With additional support, resources, time, we would like to have models for all of those reviewed by our network and available, because then it would really provide much greater confidence and fewer gaps in the maps of just what is where. We should know where these things are if we’re going to protect them.”
MOBI is available on NatureServe’s site and on Esri’s ArcGIS Living Atlas of the World. Esri founder Dangermond actually had a role in promoting the creation of MOBI, Scott said, as he was contemplating the donation to the Nature Conservancy of what became the Jack and Laura Dangermond Reserve in California, 24,000 pristine coastal acres south of Lompoc and Vandenberg Air Force Base.
“He knew of our ambitions to do this, this species habitat modeling. He really had a vision for the Map of Biodiversity Importance because he was in the process, it turned out, of working on that preserve deal. And the idea was that a map like that—showing where the most important, most biodiverse places are—could really guide others that might be in a position, like him, to do a similar investment in conservation before it’s too late.”
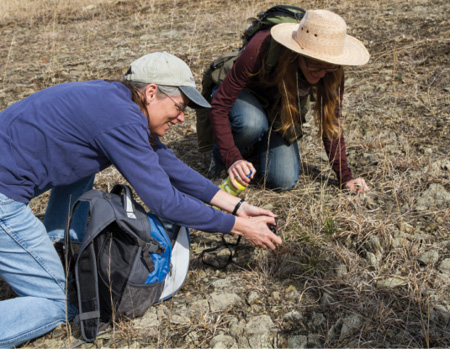
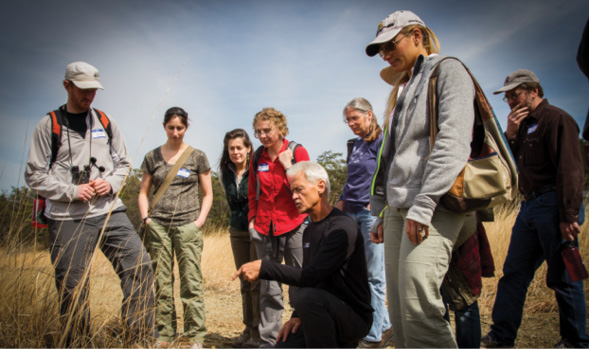
Field Biologists from NatureServe’s 2013 Biodiversity Without Boundaries Conference at Soldiers Delight, Maryland.
Photos courtesy of Sam Sheline/NatureServe.
AI AND ML
Artificial intelligence and machine learning are the key to getting usable information out of these huge datasets. In his Ted Talk, published online in early 2022, Dangermond said Esri had developed a 10-meter land cover map of the entire planet. “This was computed in less than a week using AI and machine learning,” he said.
NatureServe’s Scott said she foresees another use for AI, that of helping streamline the process of taxonomy for each species, as well as calculating how imperiled they are.
“We have a peer reviewed, reliable, repeatable process for that. We have a whole like algorithm, a calculator tool, but it’s somewhat labor intensive to do it. We factor in all kinds of things. What threats does this species face, how widespread is it? Gathering all that intel can be really time consuming, so that’s an area where we hope AI could actually help us. Could we, in a more automated way, actually comb the literature instead of an individual researcher going out and doing their Google search and pulling down all these things?”
AI could even partially automate the initial assessment of a species’ vulnerability so researchers would just have to verify it, Scott said.